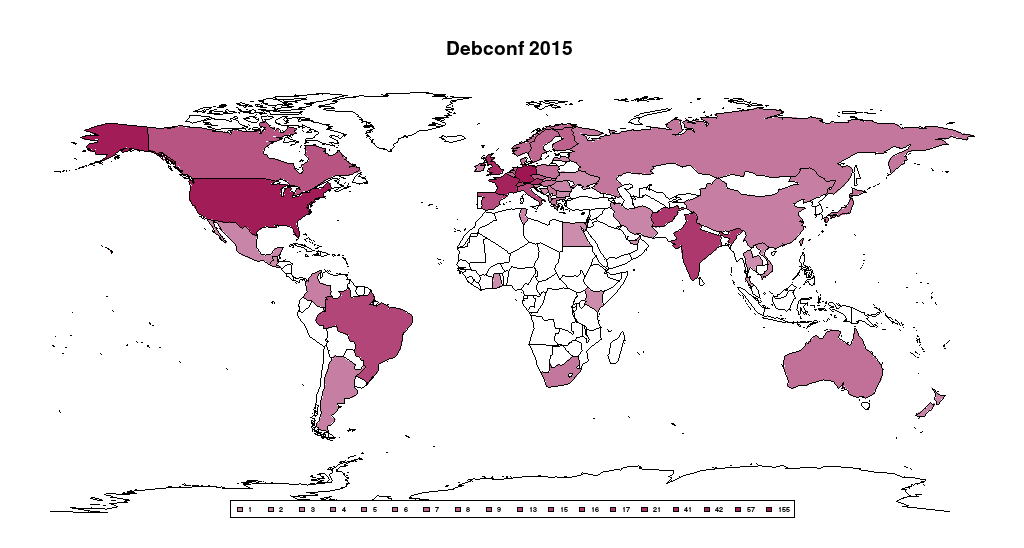
DebConf15/FinalReport/InNumbers Infographics
From Wiki
< DebConf15 | FinalReport
# R script: colored Debconf 2015 worldmap by number of visitors per country
library(maps)
# data taken from https://wiki.debconf.org/wiki/DebConf15/FinalReport/InNumbers
# debconf = read.csv("/tmp/debconf_numbers.txt", sep = "\t")
lines <- '"Persons","Country"
155,"Germany"
57,"United States of America (USA)"
42,"France"
41,"Great Britain"
21,"Austria"
17,"India"
17,"Afghanistan"
16,"Switzerland"
15,"Brazil"
13,"Spain"
13,"Italy"
9,"Canada"
8,"Czech Republic"
7,"Netherlands"
7,"Finland"
6,"Norway"
6,"Sweden"
5,"Australia"
5,"Greece"
5,"Denmark"
5,"Belgium"
5,"Japan"
5,"Poland"
5,"Hungary"
4,"South Africa"
4,"Russia"
4,"Serbia"
3,"Ireland"
3,"Colombia"
3,"Argentina"
3,"China"
3,"Israel"
2,"New Zealand"
2,"Mexico"
2,"Taiwan"
2,"Vietnam"
2,"Iran"
2,"El Salvador"
2,"Bahrain"
2,"Tunisia"
2,"Romania"
1,"Egypt"
1,"Ghana"
1,"Latvia"
1,"Albania"
1,"Guatemala"
1,"Slovakia"
1,"Ukraine"
1,"United Arab Emirates (UAE)"
1,"Bulgaria"
1,"Martinique"
1,"Kenya"
1,"Bosnia and Herzegovina"
1,"Slovenia"
1,"Thailand"'
connection <- textConnection(lines)
debconf <- read.csv(connection, sep =",")
close(connection)

    persons = table(debconf[["Persons"]])
    number_of_persons = rownames(persons)
    colors = read.csv("/tmp/colors.txt", sep = "\t")
    worldnames = map('world', names = TRUE, plot = FALSE)
    colordata = c("#CC8DAD", "#C985A7", "#C67EA2", "#C4779D",
                  "#C17097", "#BF6992", "#BC628D", "#B95B87",
                  "#B75482", "#B44D7D", "#B24678", "#AF3F72",
                  "#AC386D", "#AA3168", "#A72A62", "#A5235D",
                  "#A21C58", "#9F1552", "#9D0E4D", "#9A0748",
                  "#980043")

   usedColors  = (rep("#ffffff", length(worldnames)))

 for (country in debconf[["Country"]]) {
  persons_from_country = debconf[debconf[, 2] == country, 1]
  positionincolorvector = which(number_of_persons == persons_from_country)
  worldmapnr = which(worldnames == country)
  newColor = colordata[positionincolorvector]

  #replace a few values several times because worldmap uses differnt names, or has islands split
       if (country == "Great Britain") {
       for (z in grep("^UK", worldnames)) { usedColors[z] = newColor } }
  else if (country == "United States of America (USA)") {
       for (z in grep("^USA", worldnames)) { usedColors[z] = newColor } }
  else if (country == "United Arab Emirates (UAE)") {
       for (z in grep("^United Arab Emirates", worldnames)) { usedColors[z] = newColor } }
  else if (country == "Thailand") {
       for (z in grep("^Thailand", worldnames)) { usedColors[z] = newColor } }
  else if (country == "New Zealand") {
       for (z in grep("^New Zealand", worldnames)) { usedColors[z] = newColor } }
  else if (country == "Japan") {
       for (z in grep("^Japan", worldnames)) { usedColors[z] = newColor } }
  else { usedColors[worldmapnr] = newColor } # set color for the rest
}

# if you dont like the world as drawn here, there are more projection methods available,
# see ?map and ?mapproject
map("world", col = usedColors, fill = TRUE, resolution = 0, lty = 0)
map("world", add = TRUE)
title("Debconf 2015")
# change cex to get bigger/smaller legend, related to size of output device
legend("bottom", number_of_persons, horiz = TRUE, fill = colordata, cex=0.28)
